Simple Random Sampling
It
is a technique of drawing a sample in such a way that each unit of population
has an equal and independent chance of being included in the sample. In this
method, an equal probability of selection is assigned to each unit of the
population at the first draw. It also implies an equal probability of selecting
any unit from the available units at subsequent draws. There are two simple random sampling plans that
is Simple Random sampling Without Replacement (SRSWOR) and Simple Random
sampling With Replacement (SRSWR).
If
the unit selected in any draw is not replaced in the population before making
the next draw, then it is known as Simple Random sampling Without Replacement
(SRSWOR)
If
the unit selected in any draw is replaced in the population before making the
next draw, then the sampling plan is known as Simple Random sampling With
Replacement (SRSWR).
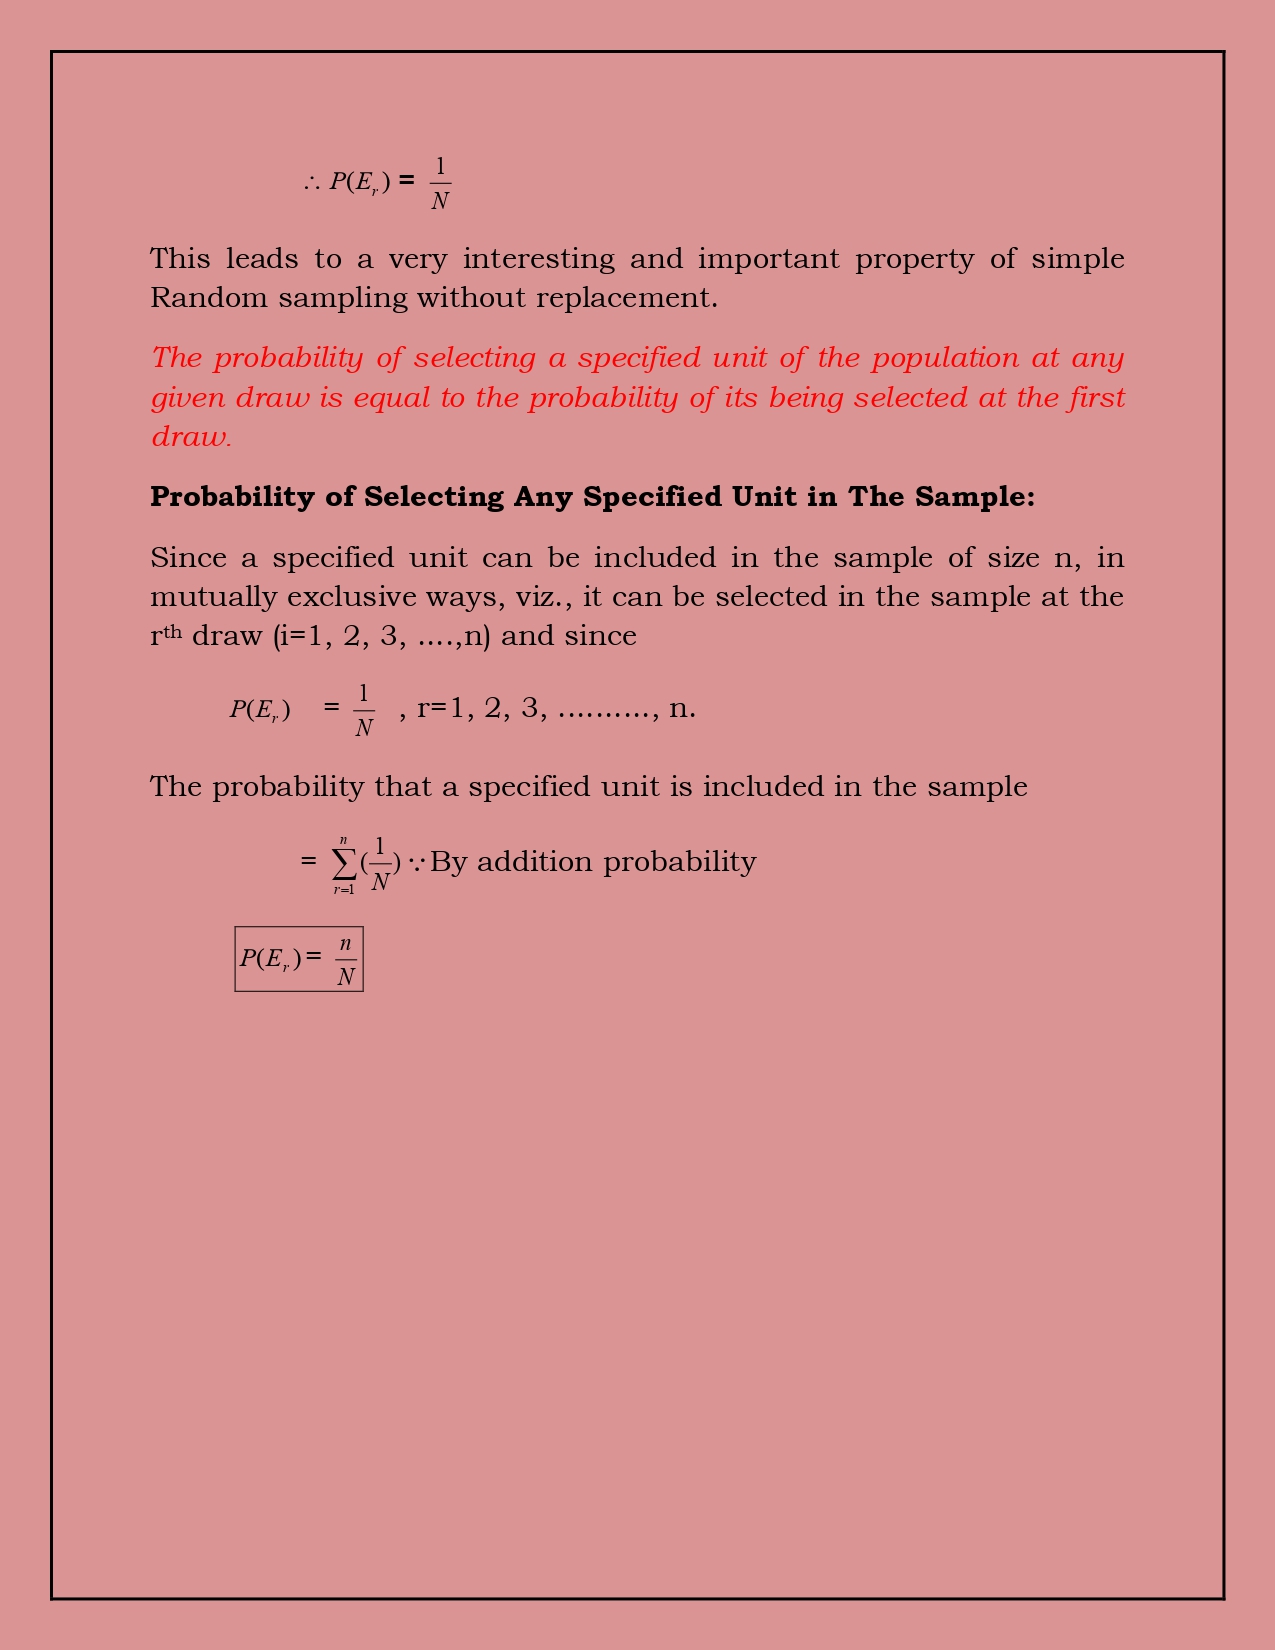
Simple Random Sampling has an important and interesting feature is that, “the probability of selecting a specified unit of population at any given draw is equal to the probability of its being selected at the first draw”. This implies that in this case from a population of size N, the probability that any sampling unit is included in the sample is 1/N and this probability remains constant throughout the drawing.
Selection methods of Simple Random Samples:
Random
sample reefers to that method of sample selection in which every item has an
equal chance of being selected. But random sample does not depend upon the
method of selection but also on the size and nature of population. Some
procedures which are simple and good for small population and is not so for
large population. In general the method of selection should be independent of
the properties of sampled population. If the selected sample should be random,
one can take proper care. Human is inherent in nature and especially is more in
sampling schemes. Hence random samples can be obtained by any one of the
following methods.
(i). Lottery Method
(ii). Mechanical randomization
or Random Numbers method.

(i). Lottery Method: It is the simplest method of
selecting random sample from the population under study. The procedure of lottery method described as:
Suppose we want to select n units out of N units.
Let
assign the numbers 1 to N (i.e., one number to one unit) to all population
units in the Universe and write these numbers on n slips, which are made as
homogeneous with respect to shape, size, colour, etc. Then, these slips are put
in a big bag and thoroughly shuffled and then n slips are drawn one by one. The
n slips units are constitute as random sample of size n.
Merit: 1. It is simplest method of drawing random samples from the Universe.
Demerit:1. If the population is sufficiently
large, then it is time consuming and cumbersome to use.

(ii).
Mechanical
randomization or Random Numbers method: It is the most practical and
inexpensive method of selecting a random sample consists in the use of Random
Number Tables. The procedure of selecting Random samples through this method
described as;
Step 1:
Identify or note N units in the population with the numbers 1 to N
Step 2:
Select at random, any page of the random number table and pickup the numbers in
any row or column or diagonal at random
Step 3:
The population units corresponding to the numbers selected in step (2) constitutes
the random sample.

Let
us consider finite units of population of size N and the requires sample size
is n. Let Yi (i=1, 2, 3, ……N) be considered as the value of the
character for the ith unit of the population and corresponding small
letters considered as the value of the character for the ith unit of
sample. Generally population parameters will be usually be denoted by either
the capital letters of the English alphabet or by Greek letters and their estimates
which are functions of the sample observation, are denoted by either small
letters or putting the symbol caps on the corresponding parameters. Thus Y hat indicates the estimate of the population mean.
 |

Non-Probability/ Non-random sampling Methods
1. Convenience Sampling: In this sampling, the sample units are selected with the convenience of Investigator. Convenient samples are selected neither by probability nor by judgment.
Merit: Useful in pilot survey
Demerit: 1. Results usually biased and
2. Unsatisfactory
2. Quota Sampling: Most commonly used in non-probability sampling. The population is first segmented into mutually exclusive sub-groups, then judgment is used to select subjects or units from each segment based on a specific proportion.
Eg: 1. In a radio-listening survey, the organization told to interview persons, out of every 100 persons, 60 are to be housewives, 25 farmers and 15 are children under age 15 years.
2. Public opinion studies.
3. Judgment Sampling: In this method of sampling the choice of sample items depends exclusively on the judgment of the investigator. It is used when the investigator thinks to be most typical to select samples from the Universe.
eg: 1. 10 students are to be selected from a class of 60 for analyzing the spending habits of students, the investigator would select 10 students who, in his opinion, are representative of the class.
Merits: 1.When only a small number of units are in the universe, SRS may miss the more important elements, where judgment selection would certainly include them in the sample.
2. When we want to study some unknown traits of population, some of whose characteristics are known, we may then stratify the population according to these known properties and select sampling units from each stratum on the basis of judgment. This method is used to obtain a more representative sample.
Limitations: 1.This method is not scientific because the population units to be sampled may be affected by personal bias of the investigator.
2. There is no objective way of evaluating the reliability of sample results. The success of this method depends on the excellence in judgment.
4. Snowball Sampling/C0ld-calling/Chain sampling/ Chain referral sampling:
It is used where potential participants are hard to find. Snowball literally means once you have the ball rolling, it picks up more “snow” along the way and becomes larger and larger. A special non probability method used when the desired sample characteristic is rare. The research starts with a key person and introduces the next on to become a chain.
Merits: 1. When the lack of desired sample/ participants
2. It may help to discover characteristics about a population that weren’t aware existed.
Limitations: 1.It is not possible to determine sampling errors or make inference about population based on the obtained sample.
SAMPLING AND NON-SAMPLING ERRORS
The errors involved in the collection, processing and analysis of data may be broadly classified under the following heads.
Sampling ErrorsNon-sampling errors
Sampling Errors
Sampling errors have their origin in sampling arise due to fact that only a part of the population has been used to estimate population parameters and draw inferences about the population.
Sampling biases are primarily due to the following reasons.
1. Faulty Selection of Sample: Some of the biases is introduced by the use of defective sampling technique for the selection of sample eg., purposive or judgment sampling in which the investigator usually selects a representative sample to obtain certain results. This bias can be overcome by strictly adhering simple random sample or select sample at random.
2. Substitution: If difficulties arise in enumerating a particular sampling unit included in the random sample, the investigator usually substitute a convenient member of the population. This obviously leads to some bias because the substitute unit may not possess the same characteristics of original sample unit.
3. Faulty demarcation of Sampling units: This type of bias arises due to defective demarcation of sampling units is particularly significant in areas survey such as agricultural experiments in the field or crop cutting survey. In such surveys, while dealing with boarder line case, it depends more or less on the discretion of investigator whether to include them in the sample or not.
4. Constant Error due to improper choice of statistics for estimating population parameters: Suppose x1, x2, x3,…….xn is a sample of independent observations, then the sample variance 
is an estimate of the population variance is biased where as the statistic
 is an unbiased estimate of σ2.
Sampling error
Sample Size
NON-Sampling errors
Non-sampling errors can occur at every stage of the planning or execution of census or sample survey. The important non-sampling errors arise due to the following factors.
1. Faulty Planning or Definitions: The planning of a survey consists in explicitly stating the objectives of the survey. These objectives are then translated into (i) a set of definitions of the characteristics for which data are to be collected and (ii) into set of specifications for collecting, processing and publishing. The following are responsible for occurring non-sampling errors.
Ø data specification may be inadequate and inconsistent w.r.t. objectives of the survey.
Ø error due to location of the units and actual measurements of the characteristics, errors in recording measurements, error due to ill-designed questionnaire etc..
Ø lack of trained and qualified investigators and lack of adequate supervisory staff.
2. Response Errors: These type of errors are introduced as a result of the responses furnished by the respondents and may be the following reasons:
ü Response errors may be accidental: Suppose the respondent may misunderstand a particular question and accordingly furnish improper information un-intentionally.
ü Prestige Bias: Sometimes the pride or prestige of person interviewed may introduce yet another kind of bias, called prestige bias. In this bias he/she may be upgrade his education, intelligence, occupation, income etc., or downgrade his/her age, thus resulting in wrong answers.
ü Self-interest: Quite often, in order to safeguard one’s self interest, one may give incorrect information, e.g., a person may give under estimate of salary or production and over-statement of his expenses or requirements.
ü Bias due to interviewer: Sometimes the interviewer may effect the accuracy of the response by the way he/she asks questions or records them. The information obtained from the interviewer is likely to influence by interviewer’s beliefs and prejudices.
ü Failure of Respondent’s Memory: Common source of error occurred by asking information related too past (time).
3. Non-response Biases: Non-response bias occurs if full information is not obtained on all the sampling units. In house-to-house survey, non-responses usually results if the respondent is not found at home even after repeated calls, he/she unable to furnish the information on all questions or if refuse to answer certain questions. Therefore, some bias is introduced as a consequence of the exclusion of a section of population with certain peculiar characteristics, due to non-response.
4. Errors in Coverage: If the objectives of the survey are not precisely stated in clear cut terms, this may result in (i). the inclusion in the survey of certain units which are not to be included, or to exclusion of certain units which were to be included in the survey under the objectives.
5. Compiling Errors: Various operations of data processing such as editing and coding of the responses, tabulation and summerising the original observations made in the survey are potential sources of error. Compilation errors are subject to control through verification, consistency check etc.,
6. Publication Errors: Publication errors i.e., the errors committed during presentation and printings of tabulated results are basically due to two sources. The first refers to the machines of publication-the proof error and the like. The other, which is more serious in nature, lies in the failure of the survey organization to point out the limitations of the statistics.
Sources: Fundamentals of Applied Statistics, S.C.Gupta & V.K.Kapoor, Fundamentals of Mathematical Statistics, S.C.Gupta & V.K.Kapoor, Sampling Techniques, W.G.Cochran
THE PRINCIPAL STEPS IN A SAMPLE SURVEY
The main steps involved in the planning and execution of a sample survey may be grouped somewhat arbitrarily under the following heads:
Objective of the Survey: The first step is to define in clear and concrete terms, the objectives of the survey. It is generally found that even the sponsoring agency is not quite clear in mind as to what it wants and how it is going to use the results. The sponsors of the survey should take care that these objectives are commensurate with the available resources in terms of money, manpower and the time limit required for the availability of the results of the survey.
Defining the Population to be Sampled: The Population, i.e., the aggregate of objects (animate or in-animate) from which sample is chosen should be defined in clear and unambiguous terms. For example, in sampling of farms clear-cut rules must be framed to define a farm regarding shape, size, etc., keeping in mind the border-line cases so as to enable the investigator to decide in the field without much hesitation whether or not to include a given farm in the population.

The Frame and Sampling Units: The Population must be capable of division into what are called sampling units for purpose of sample selection. The sampling units must cover the entire population and they must be distinct, unambiguous and non-overlapping in the sense that every element of the population belongs to one and only one sampling unit. For example, in socio-economic survey for selecting people in a town, the sampling unit might be an individual person, a family, a household or a block in a locality.
In order to cover the population decided upon, there should be some list, map or other acceptable material, called the frame, which serves as a guide to the population to be covered.
Data to be collected: The data should be collected keeping in view the objectives of the survey. The tendency should not be to collect too much data some of which are never subsequently examined and analysed. A practical method is to chalk out an outline of the tables that the survey should produce. This would help in eliminating the collection of irrelevant information and ensure that no essential data are omitted.
The Questionnaire or Schedule: Having decided about the type of the data to be collected, the next important part of the sample survey is the construction of the questionnaire (to be filled in by the respondent) or schedule of enquiry (to be completed by the interviewer) which requires skill, special technique as well as familiarity with the subject-matter under study. The questions should be clear, brief, corroborative, non-offending, courteous in tone, unambiguous and to the point so that not much scope of guessing is left on the part of the respondent or interviewer. Suitable and detailed instructions for filling up the questionnaire or schedule should also be prepared.
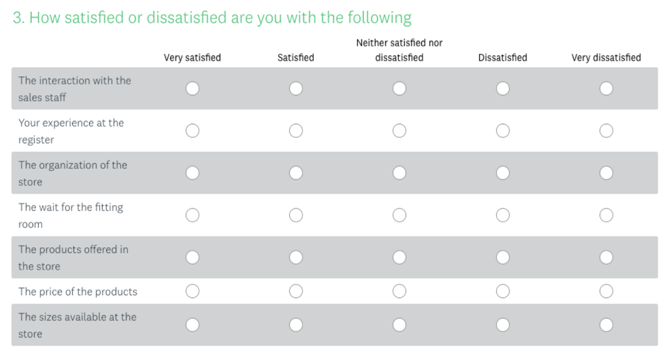
Sample Questionnaire
Method of Collecting Information: The two methods commonly employed for collecting data for human populations are:
(Ø) Interview Method: In this method, the investigator goes from house to house and interviews the individuals personally. He asks the questions one by one and fills up the schedule on the basis of the information supplied by the individuals.
Structured Interview Un-structured Interview
(Ø) Mailed Questionnaire Method: In this method, the questionnaire is mailed to the individuals who are required to fill it up and return it duly completed.
Non-respondents: Quite often (due to practical difficulties), the data cannot be collected for all the sampled units. For example, the selected respondent may not be available at his place when the investigator goes there or he may fail or even refuse to give certain information when contacted. This incompleteness, called non-response, obviously tends to change the results. Such cases of non-response should be handled with caution in order to draw unbiased and valid conclusions. Procedures will have to be devised to deal with those who do not furnish information. The reasons for non-response should be recorded by the investigator.
Selection of Proper Sampling Design: The size of the sample (n), the procedure of selection and the estimation of the population parameters along with their margins of uncertainty are some of the important statistical problems that should receive the most careful attention.
A number of designs (plans) for the selection of a sample are available and a judicious selection will guarantee good and reliable estimates. For each sampling plan, rough estimates of sample size n can be obtained for a desired degree of precision. The relative costs and time involved should also be considered before making a final selection of the sampling plan.
Organization of Field Work: It is absolutely essential that the personnel should be thoroughly trained in locating the sample units, recording the measurements, the methods of collection of required data before starting the field work. The success of a survey to a great extent depends upon the reliable field work. It is very necessary to make provisions for adequate supervisory staff for inspection after field work.
From a practical point of view a small pre-test, (i.e., trying out the questionnaire and field methods on a small scale) has been found to be immensely useful. It always helps to decide upon an effective method of asking questions and results in the improvement of the questionnaire.
Summary and Analysis of the Data: The analysis of the data may be broadly classified into the following heads:
Scrutiny and editing of the data: An initial quality check should be carried out by the supervisory staff while the investigators are in the field. Accordingly, the schedules should be thoroughly scrutinised to examine the plausibility and consistency of the data obtained. The scrutiny or editing of the completed questionnaires will help in amending recording errors or in eliminating data that are obviously erroneous and inconsistent.
Tabulation of data: Before carrying out the tabulation of the data, we must decide about the procedure for tabulation of the data which are incomplete due to non-response to certain items in the questionnaire and where certain questions are deleted in the editing process. The method of tabulation, viz., hand tabulation or machine tabulation, will depend upon the quantity of the data. For large-scale survey, machine tabulation will obviously be much quicker and economical. For a large-scale sample survey, the use of code numbers for qualitative variables is essential for machine tabulation. With simple questionnaires, the answers can sometimes be pre-coded, i.e., entered in a manner in which they can be conveniently or routinely transferred to mechanical equipment such as personal computers, etc. Finally, the tables that lead to the estimates are prepared.
Statistical analysis: After the data has been properly scrutinised, edited and tabulated, a very careful statistical analysis is to be made. Different methods of estimation may be available for the same data. Appropriate formulae should then be used to provide final estimates of the required information. Efforts should be made to keep the procedure free from errors.
Reporting and conclusions: Finally, a report incorporating detailed statements of the different stages of the survey should be prepared. In the presentation of the results, it is good practice to report the technical aspect of the design, viz., the types of the estimators used along with the amount of error to be expected in the most important estimate.
Information gained for Future Surveys: Any completed survey is helpful in providing a note of caution and taking lessons form it for designing future surveys. The information gained from any completed sample in the form of the data regarding the means, standard deviations and the nature of the variability of the principal measurements tougher with the cost involved in obtaining the data serves as a potential guide for improved together sampling.
Sources: Fundamentals of Applied Statistics, S.C.Gupta & V.K.Kapoor, Fundamentals of Mathematical Statistics, S.C.Gupta & V.K.Kapoor, Sampling Techniques, W.G.Cochran